Core Web Vitals vs Lighthouse vs Page Speed Insights: Complete Guide
Confused about the difference between Core Web Vitals, Lighthouse and Page Speed Insights? This post breaks down each tool and best practices

For SEOs and web developers, understanding how Google prioritizes user-experience elements and how to measure them is essential. That's where tools like Core Web Vitals, Lighthouse and Page Speed Insight come in. All three tools are created by Google with the aim to improve web performance and user experience.
What is Lighthouse?
Lighthouse is an auditing tool used to measure the performance, accessibility, SEO, and PWA (progressive web app) features of a web page. It runs audits in a simulated environment to generate performance scores and suggestions for improvements. The performance score is based on some core web vitals metrics, which are additional lab-based measurements.
What are Core Web Vitals?
Core Web Vitals are a set of user experience metrics that measure critical aspects of site performance, such as loading time, interactivity, and responsiveness. These metrics and targets were established by Google based on internal research on what most impacts user experience and business success. The specific metrics are discussed in further detail below.
What is page speed insights?
Page Speed Insights is similar to Lighthouse in that it provides core web vitals metrics, SEO, and performance scores. However, it combines both real-world data and lab-based measurements and only looks at a page instead of your entire website, which may limit its qualitative insights compared to Lighthouse.
Why does this matter for SEO?
In 2021 Google launched the page experience update, which changed the SEO landscape. Prior to this, websites could rank with solid technical SEO and good content. While user experience was important for conversions, it was not as crucial as SEO. However, this update gave greater priority to page experience as one of the many things evaluated when ranking a website.
For searches with numerous relevant results, pages with better user experience metrics, such as fast load times, quick interactivity, and visual stability during scrolling, have an advantage over those with poor real-world metrics.
While relevant content and technical SEO are still significant, user experience has become more critical, and all website owners should strive to receive the best scores they can out of Core Web Vitals. Sometimes there are technical limitations, and resource limitations in the way, but it is vital to understand user-experience metrics like CWV, and strive to provide as good of an experience to your users as possible.
Improving user experience also helps outside of SEO…
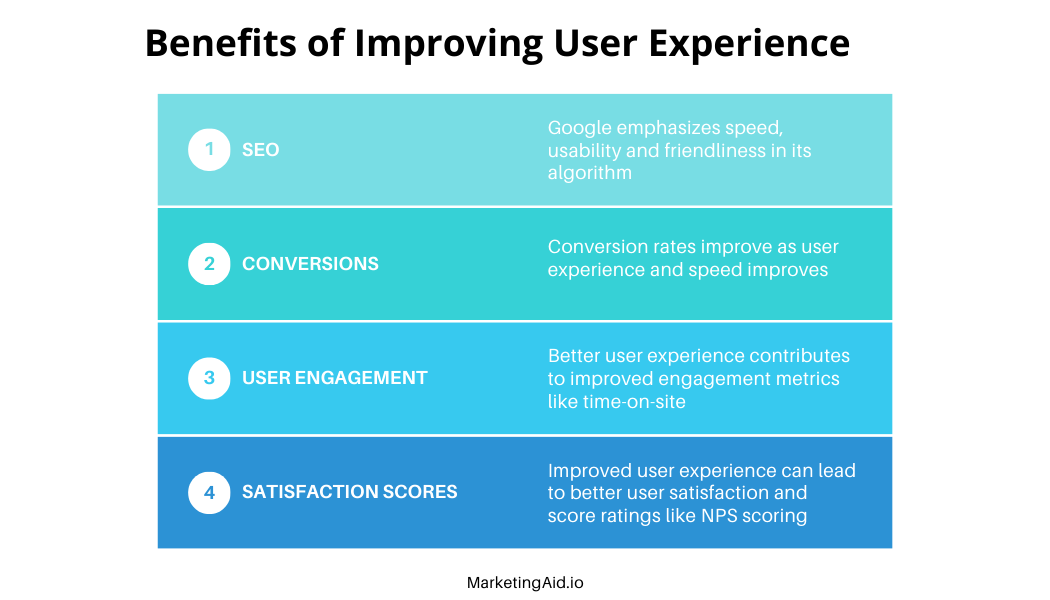
Core web vitals can help enhance website performance and user experience in areas beyond just SEO. Improving these areas will help you achieve your overall marketing goals. For instance:
Conversion Rates: Websites with faster load times and better interactivity, as measured by core web vitals, tend to see higher conversion rates. For example, one source cites a study showing sites improving LCP by 1 second gained up to 11% more conversions. Better user experience leads to less abandonment.
Engagement: Metrics like INP (discussed below) capture how responsive a site is when users try to interact with it. Faster response times keep visitors more engaged rather than frustrated. This can improve time on site, scroll depth, and other engagement metrics, making sure more of your content is seen.
Satisfaction Scores: User satisfaction surveys like NPS can improve when core web vitals enhance perceived performance. Users are much more satisfied with fast, responsive, visually stable sites. This also builds brand trust and loyalty.
The main differences between Core Web Vitals, Lighthouse & Page Speed Insights
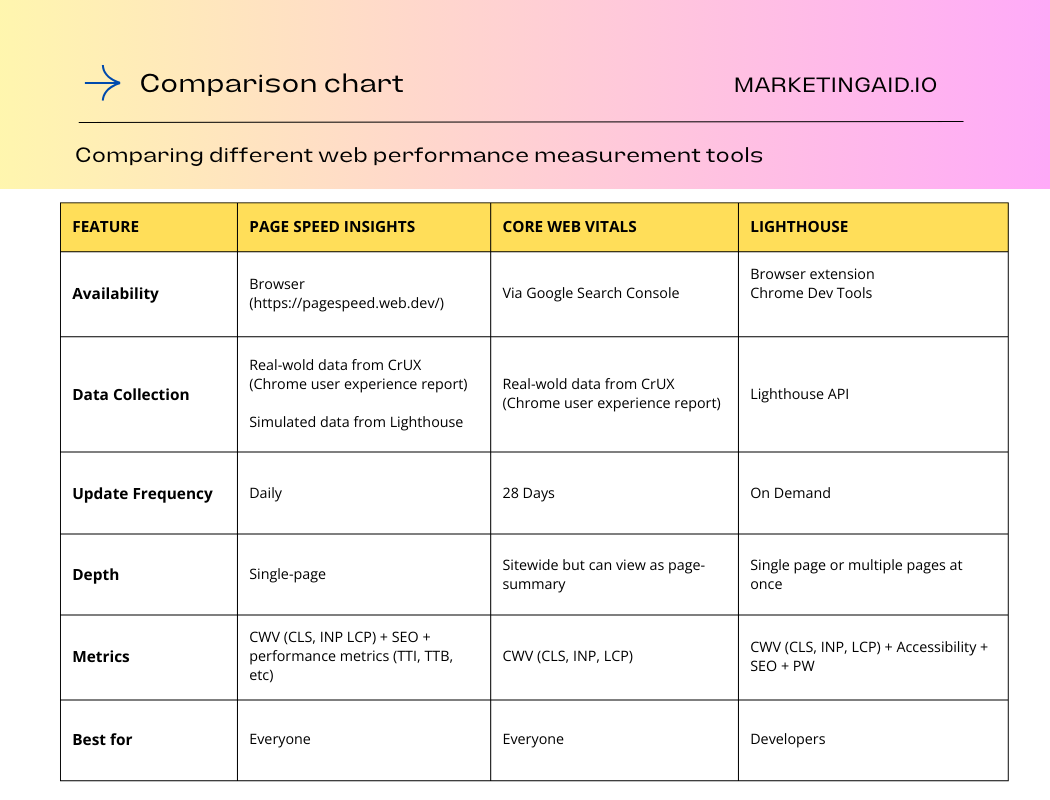
Core web vitals can be accessed via Google Search Console, while Lighthouse is ran from a command line or Chrome extension. Page Speed Insights (PSI) can be accessed through a browser.
Core Web Vitals uses real-world data collected over a 28-day period from users on Chrome user experience report (CrUX) using BigQuery. This is calculated on a page-by-page basis and updated monthly. This means if you make a change to your website that may impact user experience, you may have to wait 28ish days before checking CWV to see what the improvements are.
On the other hand, Lighthouse collects data in a simulated environment with a fixed network and CPU. It uses slower internet speeds (3G connection or throttled 4G) on a mid-tier quality mobile device. This helps ensure that websites are optimized for users accessing your site from a wide variety of devices, locations and connections.
Page Speed Insights uses a combination of both lab and field data. It collects information from the CrUX environment daily but PSI and CWV represent 28 day collection. PSI also uses Lighthouse to analyze individual URLs in a simulated environment to test a more limited set of metrics than Lighthouse provides.
How are the metrics between CWV, Lighthouse, and PSI scored?
Page Speed Insights Scoring:
PSI categorizes the user experience across different areas and places it into three buckets: Good, Needs improvement, or Poor. PSI sets thresholds in line with the Web Vitals initiative, which is also used by CWV. You can see your particular score in each area, and what a passing score would be in the report:
Core Web Vitals Scoring:
Core Web Vitals use a set of metrics that Google has determined to be the most common and relevant to all user experiences. These metrics are known as INP (previously FID), CLS, and LCP. Google aggregates these metrics either at the page or origin level. A website will pass a Core Web Vitals check if the aggregate score of all three assessments is rated as "good."
Lighthouse Scoring:
Lighthouse provides an overall weighted average of the individual metric scores it assesses. It converts each of these into a value and provides an overall score ranging from 0 to 100. Scores are classified as Good, Needs Improvement, or Poor, similar to PSI. A score from 90-100 is considered "good," 50-89 is "needs improvement," and 0-49 is "poor."
Lighthouse weights the scores for each metric differently. You can use the Lighthouse Calculator to see the different weighting of each metric. Here is an example:
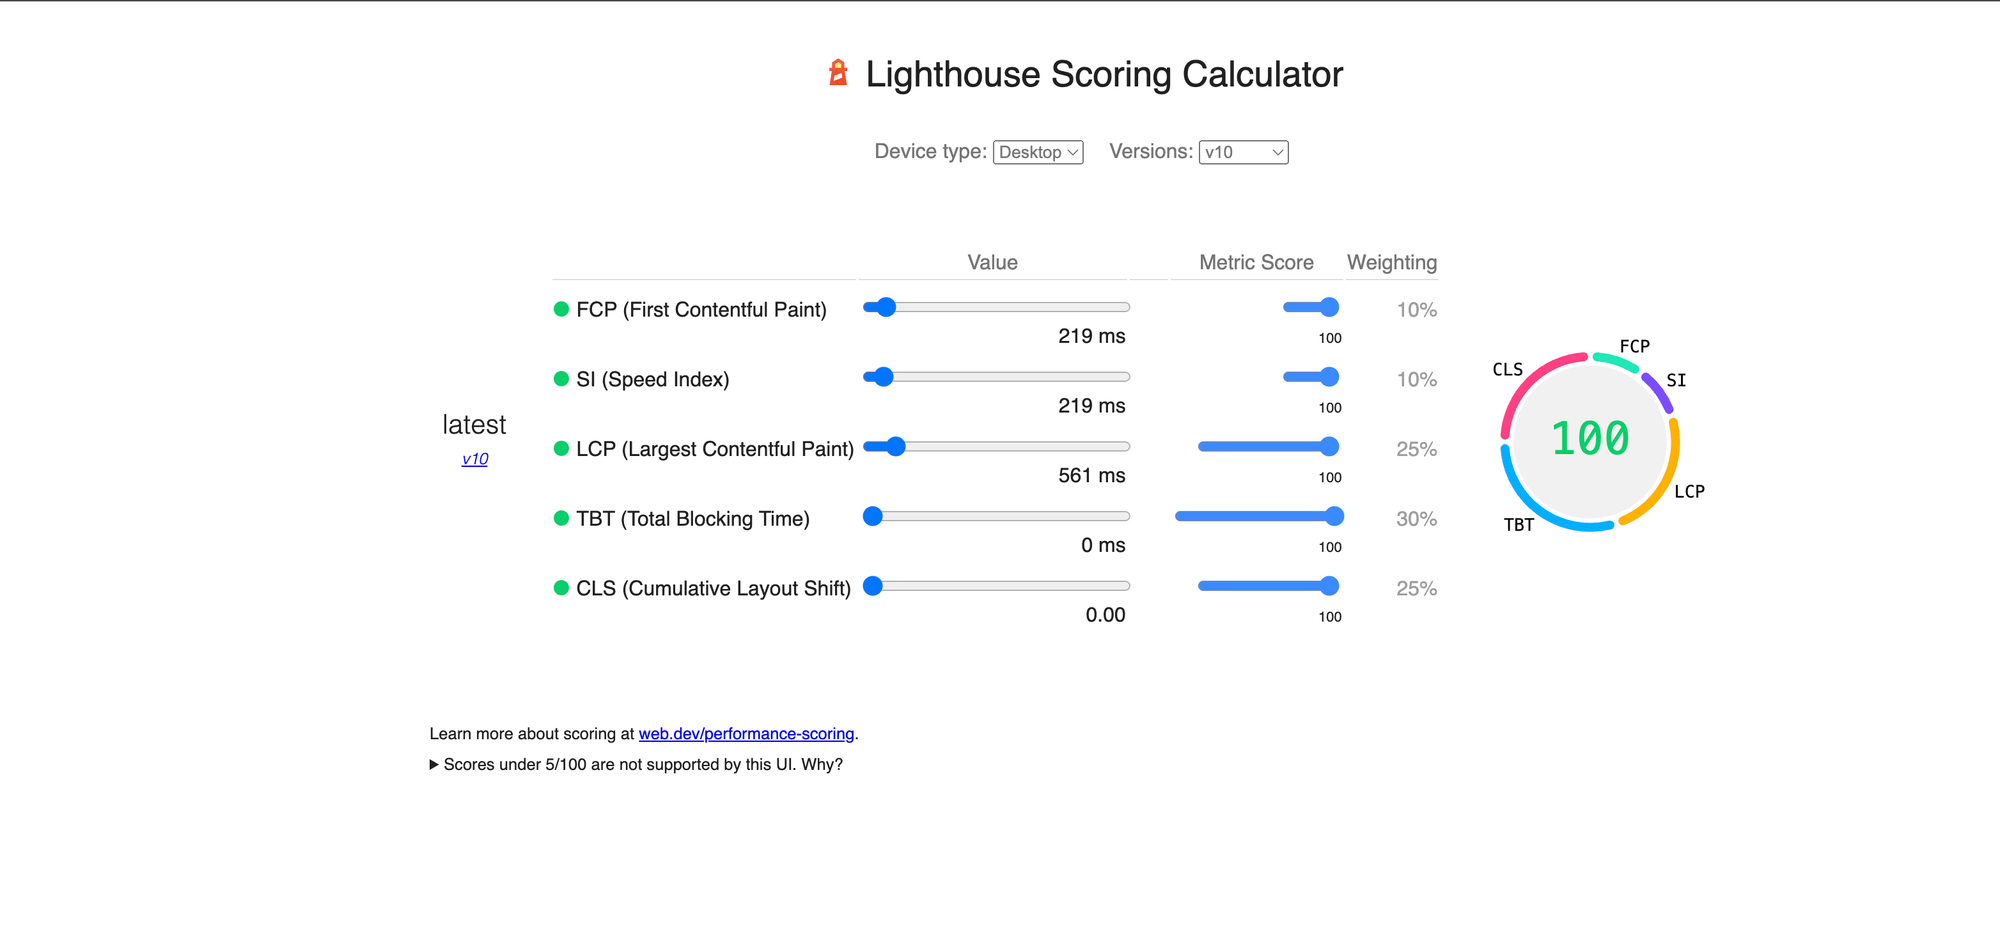
🎆 Bonus: If you achieve a score of 100 in Lighthouse, you will see a small celebration of your efforts
Core Web Vitals Main Metrics in More Detail
As discussed, CWV mainly looks at 3 areas. These are INP (As of March 12, 2024) , CLS, and LCP. Let's dive into these in more detail. Remember all of these can also be measured using Lighthouse and Page Speed Insights.
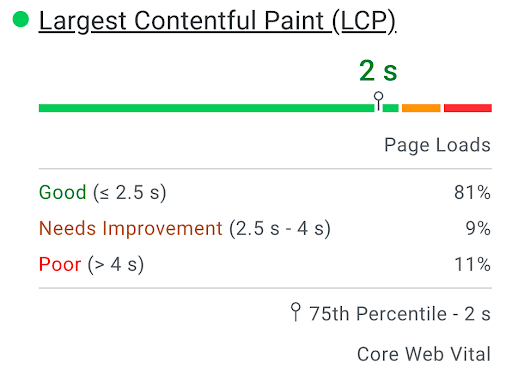
LCP: Largest Contentful Paint
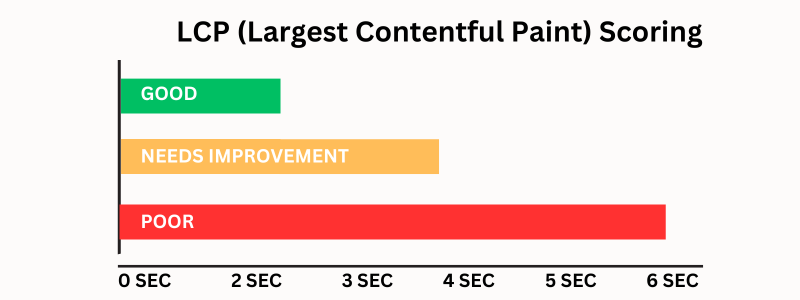
LCP basically measures the time it takes from when your browser starts to load a page, to and the largest contentful element (for example an image or a text-block) to first appear on the screen.
There are various things that can negatively impact your LCP scores. These common issues include:
Server issues: if you have a slow server response time, these elements may take more time to render, slowing down your scores.
Render blocking resources like Javascript and CSS: Many websites include external JavaScript files, CSS stylesheets, or other code that must load before the rest of the page content can be displayed. These "render-blocking" resources essentially halt rendering while they download and execute.
For example, fancy cookie consent banners, WordPress plugins injecting code, or analytics scripts often get added inline without realizing they delay the initial paint of page content. Users are left staring at a blank white screen for seconds longer, wondering if anything is broken.
Slow loading time of resources: Large, high-resolution images can significantly slow down initial page load time if placed prominently above the fold. This is because the browser cannot finish painting the visible portion of the page until these heavyweight visual assets download.
Images are often the largest content element, so minimizing their file size and deferring non-critical ones lower on the page can substantially improve LCP scores.
There are various optimization approaches like responsive images, lazy loading, WebP formats, and compression that help. Optimized and deferred image loading prevents visual assets from delaying the initial paint. This makes the page appear to load faster. Focusing on improving LCP through smarter image management is key for sites wanting to provide a smooth loading experience.
Client Side Rendering: Some web apps dynamically assemble page content on the client-side rather than server rendering complete HTML. This allows for interactive features users love. However, JavaScript-heavy pages often load slower initially, especially on first visits when code cannot be cached locally.
Solutions like server-side rendering (SSR) can mitigate this by pre-rendering parts of the page before it loads. But shifting too much to the server loses the snappy feel of client-side apps.
Getting the best of both worlds requires balancing where rendering occurs. For example, server rendering critical above-the-fold content to display fast while dynamically adding other sections. Or using lightweight frameworks that allow feature-rich apps to load quickly client-side.
Optimization involves analyzing user traffic patterns and determining an optimal split between static, cached, and dynamic content. The goal is maximizing interactivity without losing the performance gains of SSR where appropriate. Finding this balance results in fast yet fluid sites.
CLS: Cumulative Layout Shifts
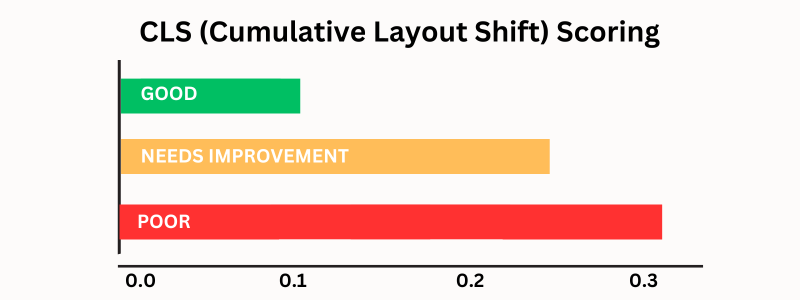
This metric looks at how many layout shifts occur unexpectedly when users are viewing your webpage. This means any time something visibly changes position on a page, within the frame. For example, you may be reading an article, when all of the sudden the content shifts down, and you are now looking at a video ad. This also includes slow loading images, pop-ups or other things that may cause a shift in the experience.
To pass CLS, you need a score below 0.10. It's important to note that this does not mean milliseconds but is instead measured by the largest burst of shifts that occur during the lifespan of the page.
There are various things that can negatively impact your CLS scores. Some common culprits that can impact this area include:
- Images without dimensions applied
- Ads, embeds, iframes, etc without dimensions
- Dynamically injected content
- Temporary or place-holder web-fonts loading until the new font is download
What is INP?
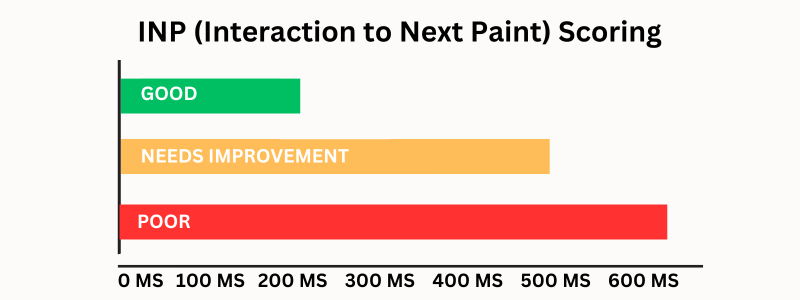
INP stands for Interaction to Next Paint.
INP is a new metric as of March 12, 2014. It will replace FID. Google found that most sites were passing the FID scoring threshold fairly easily. 93% of websites were passing the mobile experience portion of this test, while the new INP scores lowers this by a significant margin to 64% of sites doing well.
The INP metric measures the elapsed time between when a user interacts with something on a page (for example clicking a button) and the “next paint” or when the website visually updates as a response to that action.
This is when the browser spends time running code and rendering the update.
To pass INP you need a score of 200 milliseconds, or lower.
There are a few common things that can negatively impact your INP score. Some examples include:
Input Delay: When users click buttons or links on a webpage, they expect an instant visual response confirming their tap or click was registered. Even minor delays under a few hundred milliseconds can feel disjointed and sluggish.
Processing Time: When a user clicks, taps, or otherwise interacts with a website, the browser must execute code in response. This processing time is often the largest contributor to overall input delay that users perceive as sluggishness.
Simplifying unnecessary interactions: using lightweight libraries, and eliminating bloated code are key. This allows interactions to process faster so visual responses feel snappier.
Presentation Delay: Web browsers must determine how and where to display page elements by parsing HTML, CSS, and other code. This presentation delay involves calculating details like text sizing and colors, image dimensions, element positioning, and animations.
So which results should you rely on?
Some people ask why CWV and Lighthouse metrics are so different. As a reminder, these are simulated vs real-world metrics which can cause differences. You can read this report on the differences in more detail.
The answer on which to use, is it depends:
When adjusting for SEO, you should rely on Core Web Vitals metrics since it represents real-world data. The simulated data Lighthouse uses (and by extension PSI) is slower than most connections, which might not reflect your actual user’s experiences.
However if you need immediate feedback on changes you have made, it is useful to get a benchmark in either PSI or Lightroom, then compare after your change. This can help you better predict how it might be reflected in CWV later on.
If you want to improve overall accessibility, speed, and user experience as a whole, Lighthouse gives you the best breakdown of recommendations across a wider range of factors.
It is important to note if you're a developer and you're running Lighthouse in a local environment, that your scores are unreliable due to the fact it's simulated. For example, if you have an index.html with only one div tag - you'll still get a 100% SEO score.
In Summary (TL,DR)
📈 Core Web Vitals Metrics is more directly measured in relation to SEO
🚥 Lighthouse helps measure CWVs and has a focus on speed
💻 Lighthouse is simulated, while CWV uses real-world data and can take 28 days to update.
⚙️ Page Speed insights uses a combination of lab metrics and real-world data
3️⃣ The three most important metrics for SEO are LCP, CLS and INP